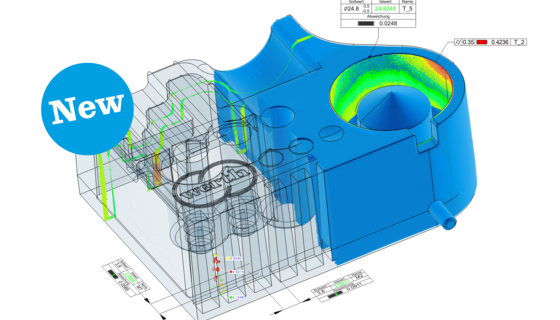
For analyzing the 2D dimensional cross sections that are generated, the same software functions are used as for analyzing contours scanned by image processing or with a probe. Individual contour segments can be selected by drawing windows. Standard geometric elements, such as lines or circles, can be calculated from the contours. The results are then calculated by selection of source elements and dimension type.  The results of the nominal to actual comparison are shown for a cross section. Like in the 3D method, the deviation between the actual points and the nominal contours are derived and plotted in a color and length coded plot.  Depending on the alignment method, there are different potential results.

Seen in the image above: 2D analysis with WinWerth software: a) Measuring dimensions in the 2D cross section b) 3D BestFit of the entire point cloud to the CAD model c) 2D BestFit of the measured object in one cross section, using the Gaussian method (minimizing nominal to actual deviations) d) 2D ToleranceFit of the measured object in one cross section (optimized to the least tolerance deviation or consumption): areas with tighter tolerances are prioritized, and the component is in tolerance. b-d) Nominal to actual comparison in 2D cross sections; in b) and c), tolerances are exceeded in the zones with tighter tolerances, because the tolerances are not taken into consideration for the alignment.