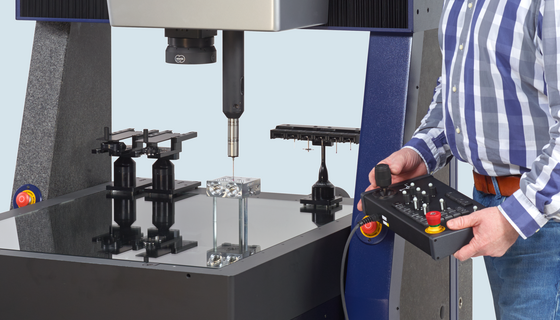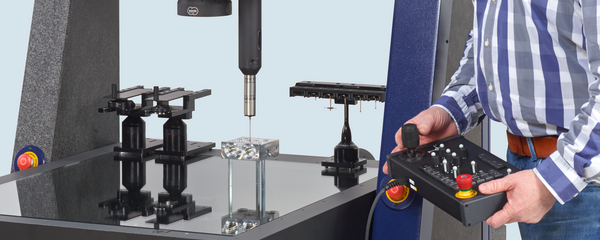


Production monitoring or laboratories, small or large workpieces, optical sensors, multi-sensor systems or ...
learn more
-
Applications
- 3D free-form workpieces
- Extruded workpieces
- Molds
- Semiconductor workpieces
- Lithographic structures
- Metal-plastic composite workpieces
- Prismatic workpieces
- Punched and bent parts
- Packaging
- Shaft-Hub Connections
- Shafts and Axes
- Workpieces with micro-features
- Optics and Lenses
- Tools with precisely defined cutting edges
- Tools with complex or irregular cutting edges
- Gear wheels
- Cylindrical workpieces
- Industries
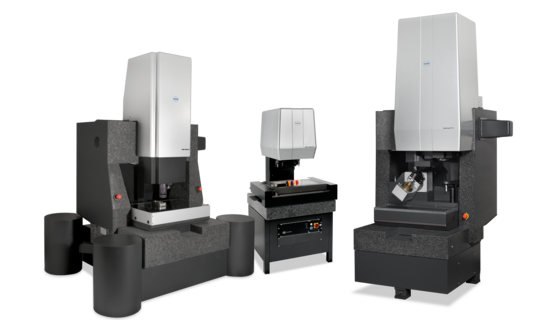
- Our products
- Werth service
- About Werth
- Careers
- Foundation
- Publications
- Downloads