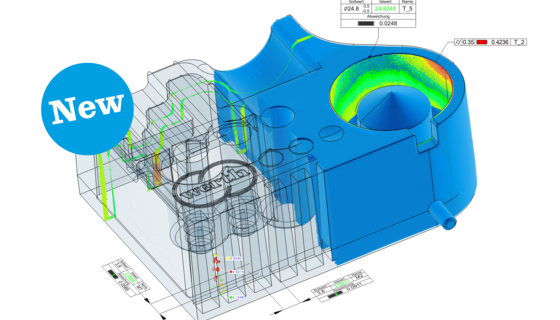
A direct comparison of the actual work piece geometry to the nominal geometry, such as CAD data or previously measured master parts, is particularly useful when measuring free form surfaces. However, even form deviations of standard geometric elements or paired geometries, such as hole patterns and interlocked elements, can be analyzed effectively using this method. Corrections of plastic injection molds or molds for metal castings can also be made on the basis of nominal to actual comparisons. It makes sense to use all of the measurement points captured by tomography when performing a nominal to actual comparison. First, it is necessary as previously described to align and overlay the measured point cloud and the CAD data. The software then calculates the distances from the individual measurement points to the CAD surface. These distances are then compared to the tolerances for that area of the work piece. Depending on the magnitude and sign of the deviation and its classification as exceeding or meeting the tolerance, the individual measurement points are displayed in different colors. This graphic representation is called a color coded deviation plot. The general advantage of this method is that the deviations of the actual geometry from the nominal geometry can be seen at a glance. The tolerances used for the analysis can have different definitions and can be assigned globally to the entire part, or to individual geometric elements or CAD patches. The tolerance zones themselves can also be used to optimize the alignment. The “tolerance fit” function fits the measurement point cloud into the tolerance band so that the tolerances are minimally exceeded respectively the measured points utilize a minimum of the tolerance band. This process corresponds to the typical application of mechanical gages for simple geometries and can also be applied to complex work piece geometries with this soft- ware function. The deviation plot is generated as described above. In some cases, the necessary CAD data set is not available for a nominal to actual comparison, for instance when measuring design models or modified prototypes. Master parts are then used in place of CAD models. They are scanned with tomography in advance, and the measured points are used as the nominal data set for comparison with the data of the parts to be analyzed. The analysis and display of results is the same in this case as described above.
NEWS
Werth Knowing
Copyright © 2023 | Werth Inc | (860) 399-2445 | 8 Custom Drive, Old Saybrook, CT 06475